How do I use remotely sensed data?
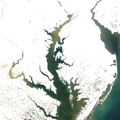
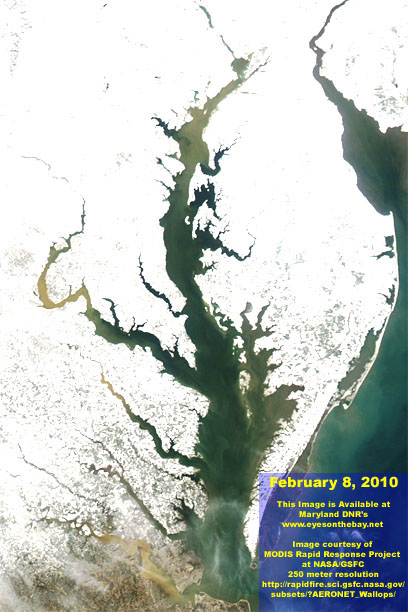
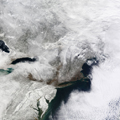
Data can be used for a variety of educational purposes. For example, the image to the left was taken February 8, 2010, following a major snowstorm that hit the Chesapeake Bay regoin. This represents one type of remotely sensed data that can be used to discuss weather and climate events. For a larger version of this image, click here.
Image credit: MODIS Rapid Respons Project, NASA, GFSC.
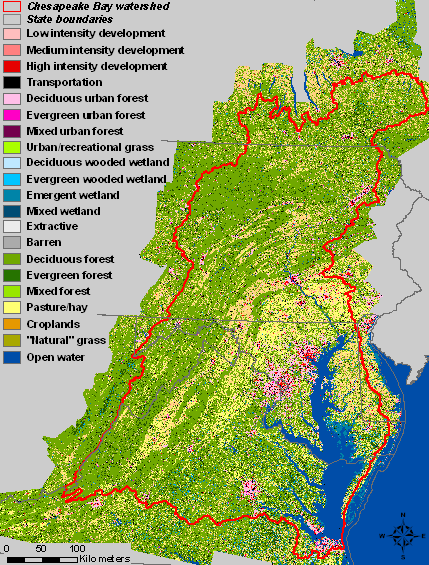
This data may also be used to show land cover. For example, land cover data can show the types of forests in the region, type and density of development, and even transportation networks. 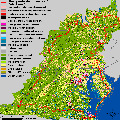 The image on the left shows land cover data for the Chesapeake Bay region from 2000. To see a larger version of this image, click here. However, land cover changes can occur rapidly. Monitoring changes in land cover over time is an important educational aspect of using this type of data.
Image credit: Woods Hole Research Center, Mid Atlantic Region.
ChesapeakeView:Images of Interest
In addition, the ChesapeakeView team will be looking for unique images and data to highlight on the website. These images, combined with other data, often serve to tell important stories about habitat, biodiversity, climate, and earth systems.
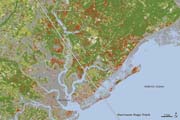
For example, the image to the left is part of the results from a recent study that integrated field surveys and before and after satellite imagery that examined the impact of hurricanes, in this case Hurricane Hugo, on migratory bird populations. For more about this image and the study, see the NASA Earth Observatory story.
Image credit: NASA image by Robert Simmon, based on data from Chad Rittenhouse, Department of Forest and Wildlife Ecology, University of Wisconsin-Madison. Caption by Rebecca Lindsey. Instrument: Landsat 5 - TM
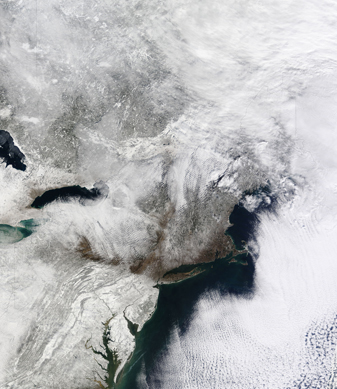
This image is from the massive snow storm that hit the Chesapeake Bay region and northeast on February 10, 2010. To see a larger version of this image, click here.
Image credit: Jeff Schmaltz, MODIS Land Rapid Response Team, NASA GSFC .
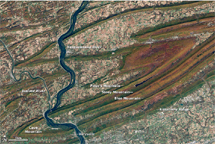
This image shows the fabulous fall foliage in Central Pennsylvania along the Susquehanna River which feeds into the Chesapeake Bay. The Bay region is comprised of many states including a large portion of Pennsylvania.
Image credit: NASA image by Robert Simmon, based on Landsat data from the University of Maryland Global Land Cover Facility.